KOA Weather Service
The Keck Observatory Archive preserves ancillary weather data for each night, including observatory-generated plots of weather data and CONCAM webpages. Links are also provided to external sources of useful weather data.
All types of ancillary weather data may not always be available for a given night.
To retrieve ancillary weather data, scroll down to the bottom of More Options Search form which looks like the following:

Enter a date or a range of dates (not exceeding 30 days), and you will be shown a page with links to all the available weather data for those nights.
- Interactive Weather Plots (available starting 2019 Feb 21)
- Static Weather Plots (prior to 2019 Feb 21)
Interactive Weather Plots
KOA uses the Bokeh extension of HoloViews to create interactive plots of weather and seeing data.
Using HoloViews Bokeh Plots:
Below is an image showing a Humidity v Time HoloViews Bokeh plot:
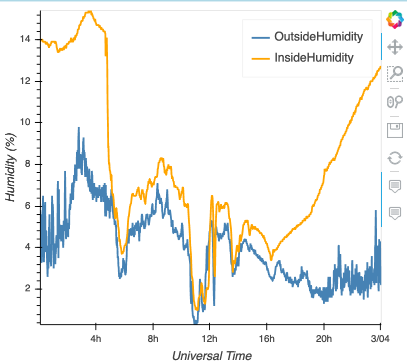
As you move your cursor over the plot, the values of the current point will be displayed. By default, clicking/dragging will move the plot within the window.
The vertical strip of icons on the right-hand side of the plot allow the user to change how they interact with the image. The currently-active selection is highlighted with a vertical blue line on its left.
Icon Legend:
 |
Link to the Bokeh webpage Move the plot within the window (default) Click/drag to zoom in on an area Zoom in/out by the scrolling the mouse button Save the image Reload to default view Show/Hide mouseover information for plot #1 Show/Hide mouseover information for plot #2 |
Sources of Data
Note: Some plots and images are obtained from external sites, and may be blank or missing for certain nights. For example, if the weather atop Mauna Kea is bad, then the DIMM/MASS data will not have been collected.
Weather Plots (Keck 1 and Keck 2):
The Keck 1 and Keck 2 Weather Plots are generated from weather data collected and stored at Keck Observatory, including temperature, humidity, pressure and dewpoint throughout the observing night.
Keck Guide Star FWHM Plots:
These plots show the nightly guider data collected and stored at Keck Observatory (when available).
SkyProbe @ CFHT: Atmospheric Attenuation:
This image is obtained from CFHT and shows plots of atmospheric attenuation data when available.
CFHT Seeing and Mass Profile:
These data and images are collected from the Mauna Kea Weather Center. Text files of the DIMM, MASS and MASS profile data are available. A HoloViews Bokeh plot is created for interaction with the DIMM and MASS data. In addition, several images are downloaded from CFHT showing the MASS profile, DIMM seeing histogram and MASS seeing histogram.
Static Weather Data (prior to 2019 Feb 21)
For each night, the data may include:
- Plots of WMKO-observed weather data like temperature and humidity: wx.ps and/or wx.pdf
- Guide-star FWHM plot for the night: fwhm.ps and/or fwhm.pdf
- A link to the CONCAM pages for that night, if available (no CONCAM data exists for dates after 2007)
- Link to Mauna Kea Weather Center's seeing data (available since September 24, 2009)
- Link to UH All-Sky Camera's night movie in AVI format (available for 3 months after date of observation)
- Link to Atmospheric Attenuation plots from SkyProbe@CFHT (available for dates since April 2, 2001)

Please acknowledge the use of KOA by including this text in your publications:
This research has made use of the Keck Observatory Archive (KOA), which is operated by the W. M. Keck Observatory and the NASA Exoplanet Science Institute (NExScI), under contract with the National Aeronautics and Space Administration.
Please also acknowledge the PI(s) of datasets that have been obtained through KOA, and please contact the KOA Help Desk if you publish archival data.
If your research uses data reduced by the DEIMOS, KCWI, MOSFIRE, or NIRES PypeIt DRP, please use the PypeIt Citation.
If your research uses data reduced by the KPF DRP, please use the citation as described in the README.md.
Privacy Policy Image Use Policy
The Keck Observatory Archive (KOA) is a collaboration between the NASA Exoplanet Science Institute (NExScI) and the W. M. Keck Observatory (WMKO). NExScI is sponsored by NASA's Exoplanet Exploration Program, and operated by the California Institute of Technology in coordination with the Jet Propulsion Laboratory (JPL).