Data Discovery Service User Guide
Accessing the Data Discovery Service
KOA announces the beta release of the Data Discovery Service. This service is intended to return inventories of the archive contents in seconds through fast spatial and temporal searches which can then be filtered post-query. It is not intended to be a faster version of the “Basic Search" and "More Search" services.
Background
The Keck Observatory Archive (KOA) Data Discovery Service (DDS) is a new query engine that allows fast searches over the entire KOA inventory. Results from all Keck instruments are included in the search since there is minimal performance gained by excluding instruments. Users requiring more refined search constraints are encouraged to use our web interface or any of our supported APIs.
Logging In
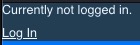
The DDS can query proprietary data in addition to those that are publicly available. In order to access your own proprietary data, you will need to log in to the KOA service via the link in the upper left corner of the page. This link will open a new browser tab, where you can log in using your KOA credentials. When you switch back to the DDS tab, the status message in the upper left corner will indicate you are logged in and provide a link for when you decide to log out. Note that you can also log out in the same tab in which you logged in; your log in status will be updated on the DDS accordingly.
Entering Search Criteria

The service currently has four input parameters, only one of which ("Object Name or Coordinates") is required. Object names are resolved to a sky position by either NED or SIMBAD. This service also accepts positions in decimal degrees and sexagesimal. Only coordinates in equatorial coordinates (i.e. right ascension and declination) are allowed. Some example inputs are:
- Kelu-1
- 196.417350 -25.684920
- 13:05:40.16 -25:41:05.7
The search radius can be any value between 0.1 degrees and 6 degrees; the default radius for a search is 0.1 degrees. The search is performed by checking the radial distance between the input coordinate and the RA/Dec recorded in the FITS headers. Given that the field of view for some instruments can be several arcminutes, using a small search radius could miss observations where the input position is on the FOV, but beyond the search radius. Therefore, it is advisable to use a large radius for the search. With the speed of the inventory search, the difference in the query time between 0.1 degrees and 6 degrees is minimal.
The observation dates of the queried observations can be constrained using the "Start Time" and "End Time" boxes. The dates are assumed to be UT and take the form YYYY-MM-DD.
Instrument Summary Table
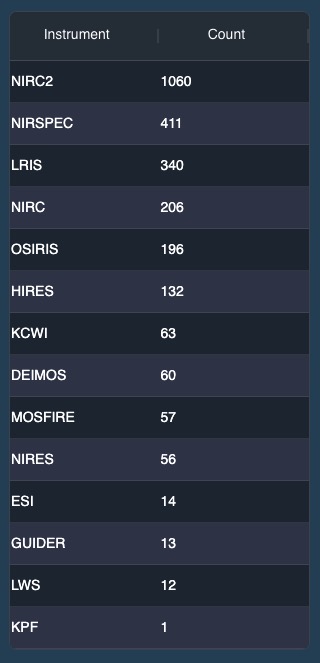
For a successful search in which data have been found in the KOA inventory, an Instrument Summary table will appear on the left side of the page. This table lists each instrument for which data were found, along with the number of files found. These file counts include public and proprietary (provided you have access rights) science files matching the search criteria. By default, this table is ordered by the number of files found, but can easily be sorted by instrument name by clicking on the "Instrument" column header. Clicking on a row in this table brings up the Observations Table for that instrument.
Observations Table

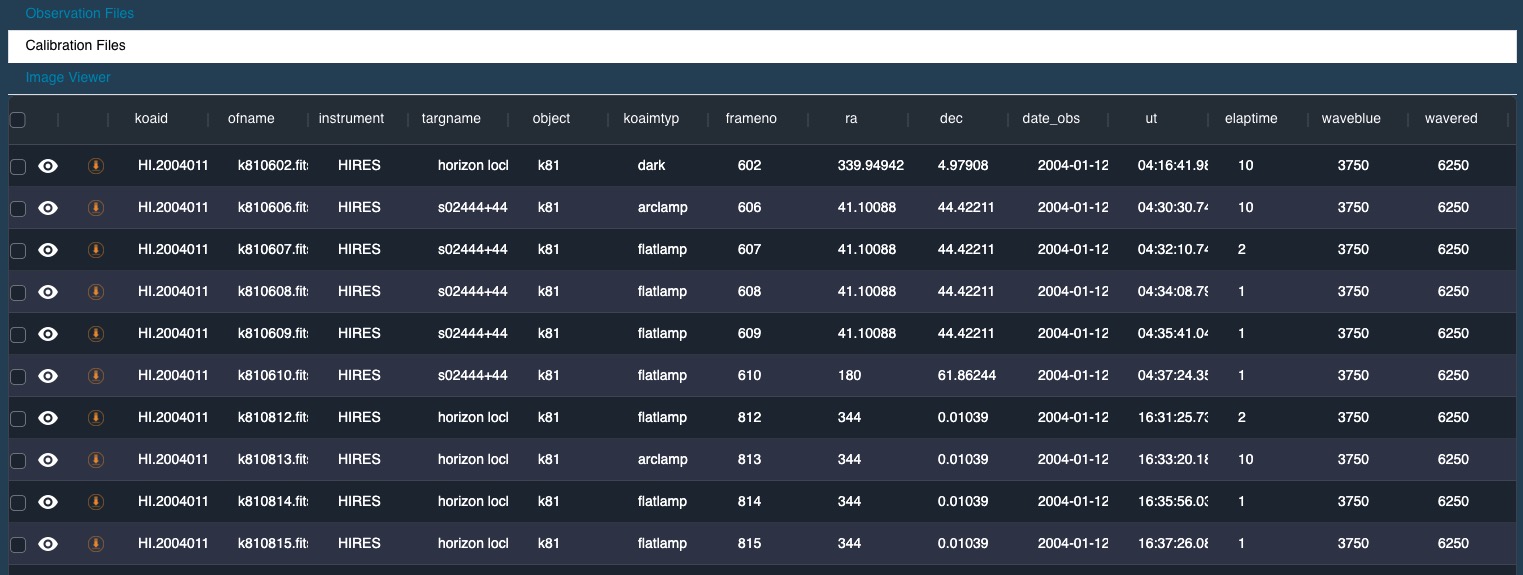
The Observations Table provides information about the data discovered in the query. This table is interactive and columns can be sorted by clicking on a column header, filtered by clicking on the three horizontal lines that appear when your cursor hovers over a column header, and moved by dragging a column header horizontally to a new position. The width of each column can also be changed by clicking and dragging the vertical bars separating column names. Clicking on a tab at the top of the table with an instrument name is equivalent to clicking on the instrument name in the Instrument Summary Table.
This table allows you to examine and download the observations:
- Clicking on the "eyeball" (
 ) brings up a static preview image (if one exists) and the header from the FITS file.
 - Individual files can be downloaded by clicking on the "down arrow" icon (
 ).
). - If you want to download many files, then use the check boxes to select rows and click the "Download Selected KOAIDs" box to generate a wget script.
- Clicking anywhere else in a row brings up the links to view the Science Files Table, the Calibration Files Table, and Interactive Image Visualizer.
Science Files Table

The Science Files Table lists all science files related to the observation. At a minimum, this table will have the raw FITS file (lev 0). Other files that can appear in this table can be static preview dds_images of the raw data, quick look data products (lev 1), and files created by a pipeline to produce science quality data (lev 2). All of these can be examined using the "eyeball" or downloaded using the "down arrow." As with other tables in this service, the columns can be sorted, filtered, and moved as needed.
Calibration Files Table
The Calibration Files Table lists calibration data that can be used to reduce the raw data. These files are based on the results of the automated Calibration Association. As a result of this process, it is possible for the Calibration Files table to be empty if no calibration files were able to be associated with the science file.
Interactive Image Visualizer
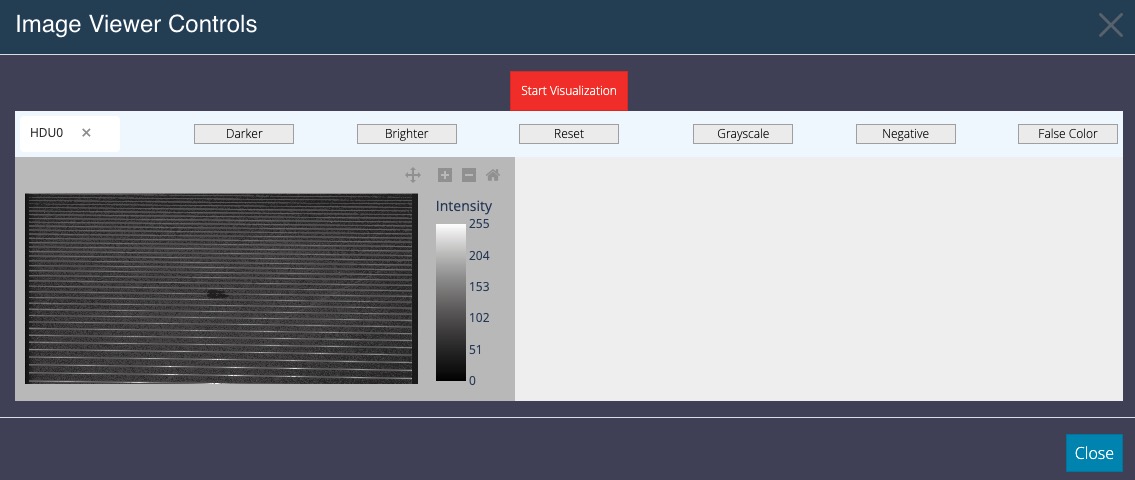
The Interactive Image Visualizer ("Image Viewer") is a simple, interactive tool used to examine the data in the raw FITS file. Current capabilities allow for image zooming and changing the color palette to grayscale, negative grayscale, and false color. The tool only shows data from a single HDU in the file, if the FITS file contains data in more than one HDU, you can switch between the different HDUs using the dropdown menu in the upper left.
Interactive Table Usage

Filtering
When you hover your cursor over a column header, you will notice an icon with 3 vertical bars appearing on the right side of the column header.Clicking on this icon brings up the tool for filtering. The filtering options you will see are dependent upon whether the data in the column is purely numerical or text (mixture of numbers and characters).

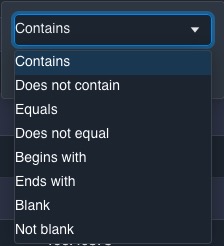
The filters allows you apply up to two constraints per column by linking them with either "AND" or "OR." When a column has an active filter, a new icon will appear next to the column name.

To clear the filter, simply open the filtering options popup and delete the text used for the filter.
Sorting
Clicking anywhere in the column header except for the filtering icon cycles through the sorting options for that column. The first click sorts the table by increasing values in that column, the next click sorts the table by decreasing values in that column, and the third click removes the sorting and returns the rows in the table to their original order. For columns comprising of mixture of numbers and characters (ex. Target Name), "increasing" uses the following order of precedence: numbers, upper case letters, lower case letters.


DDS Notebook
KOA announces the beta release of a Jupyter notebook, which downloads a list of protostars in the Rho Ops dark cloud in SIMBAD, uses the KOA data discovery service to return an inventory of all Keck observations of these protostars, and interactively visualize their locations on Spitzer IRAC map of Rho Oph, acquired from IRSA. Users may modify this Notebook to support their own use cases.
The Notebook uses version 2.3.1 of MontagePy, which must be installed from the wheels available on the Montage website, or on GitHub. It is not yet available in PyPi.
Please acknowledge the use of KOA by including this text in your publications:
This research has made use of the Keck Observatory Archive (KOA), which is operated by the W. M. Keck Observatory and the NASA Exoplanet Science Institute (NExScI), under contract with the National Aeronautics and Space Administration.
Please also acknowledge the PI(s) of datasets that have been obtained through KOA, and please contact the KOA Help Desk if you publish archival data.
If your research uses data reduced by the DEIMOS, KCWI, MOSFIRE, or NIRES PypeIt DRP, please use the PypeIt Citation.
If your research uses data reduced by the KPF DRP, please use the citation as described in the README.md.
Privacy Policy Image Use Policy
The Keck Observatory Archive (KOA) is a collaboration between the NASA Exoplanet Science Institute (NExScI) and the W. M. Keck Observatory (WMKO). NExScI is sponsored by NASA's Exoplanet Exploration Program, and operated by the California Institute of Technology in coordination with the Jet Propulsion Laboratory (JPL).